Unlocking the Power of Azure Sentinel for Veeam Syslog Analysis
For those of you who swear by Veeam for backups and disaster recovery but want to supercharge your security game, then I've got some news for you: it's time to call in Microsoft Azure Sentinel to analyze Veeam syslog, which is now an included feature in VBR 12.1.
What’s Sentinel?
If you’re new to the Azure Sentinel, think of it as AI-backed SIEM (Security Information and Event Management) and SOAR (Security Orchestration, Automation, and Response), enabling holistic security operations for your enterprise. It's like the Swiss Army knife of threat hunting—detecting, investigating, and responding to attacks to minimize "security breach."
Maximizing Security with Veeam Syslog and Azure Sentinel
Unified data and real-time insights through Azure Sentinel's integration of Veeam syslog
Automated playbooks for proactive defense and quick incident investigation
Built-in analytics for smarter alerts using machine learning
Scalability and integration with other security tools
Creation of an ecosystem that covers all backup bases
Get ready to supercharge your data protection game with Veeam syslog and Azure Sentinel!.
Maximizing Data Protection with Azure Sentinel and Veeam Syslog
Set up Log Analytics Workspace
Enable Syslog Connector. In my lab this consisted of a Linux VM in my vSphere lab.
Configure Veeam Syslog Settings. A feature included in VBR 12.1. Find more on that here
Map log data to Sentinel for hunting, alerting, and visualization
Azure Sentinel is a native service managed through the Azure Resource Manager
What is KQL?
Kusto Query Language (KQL) is a powerful, read-only language designed to query structured, semi-structured, and unstructured data. It is primarily used with Azure Data Explorer for swift and interactive analysis of vast data sets.
Why Use KQL?
KQL is optimized for efficiently handling massive volumes of data, making it suitable for tasks like log analysis, telemetry data crunching, and monitoring for applications and infrastructure. It also adds deep integration with various Microsoft services like Azure Monitor, Azure Log Analytics, and Application Insights.
The Syntax
KQL's syntax is easy to pick up, especially for those familiar with SQL. It includes familiar clauses such as Where, Summarize, Project, and Join, making it relatively straightforward to learn. Here's an example I pulled from the Microsoft Training on the subject. .
// Retrieve rows from the 'Logs' table where the 'Level' is 'Error'
Logs
| where Level == "Error"
| project TimeGenerated, Message, Computer
| order by TimeGenerated desc
We see here the query retrieves records from the table name Logs. Then filters those logs to ones including the statement "Error". Then sorting them by ‘TimeGenerated’ for display. Making sense of the large collection of Syslog. Now let's examine this with events with more specific Syslog generated by VBR.
Veeam SysLog
As mentioned above, KQL is used in conjunction with Azure Data Explorer, or to create queries that trigger incident response. In this example I will simply demonstrate the use of KQL under Analytics in my Sentinel Workspace.
Utilizing the Event codes listed in Veeam Help Center to create a specific query, which find events documenting the removal of restore points. An event that doesn't necessarily mean anything malicious as this happens daily as retention limits are met. But an event of interest nonetheless.
Example of a basic query to find all events with the code ‘10050’ which corresponds to deleted restore points in Veeam.,
But these logs don't yet tell us much. Let's sort them a little further, and parse these logs a bit further and see if we can't sort them in a way to make them more actionable. The 'SyslogMessage' field contains specific data that can help locate potentially malicious events. Avoiding manually opening every log to find non-system generated events I sorted the logs to those that might contain potential malicious events.
Example of what the raw Syslog message contains
In order to extract information from the Syslog Message, I will parse out the DateTime, VmName (or job name), and the Description. This will provide per-tenant information on each event. The results display a clearer view of the time of the event, the backup job name, and a brief description of the action. However, manually going through the list still poses the risk of missing events of real interest.
Make it stand out
Here I started to parse out pertinent data from the Syslog Message. Then formatted it is an easier to read format.
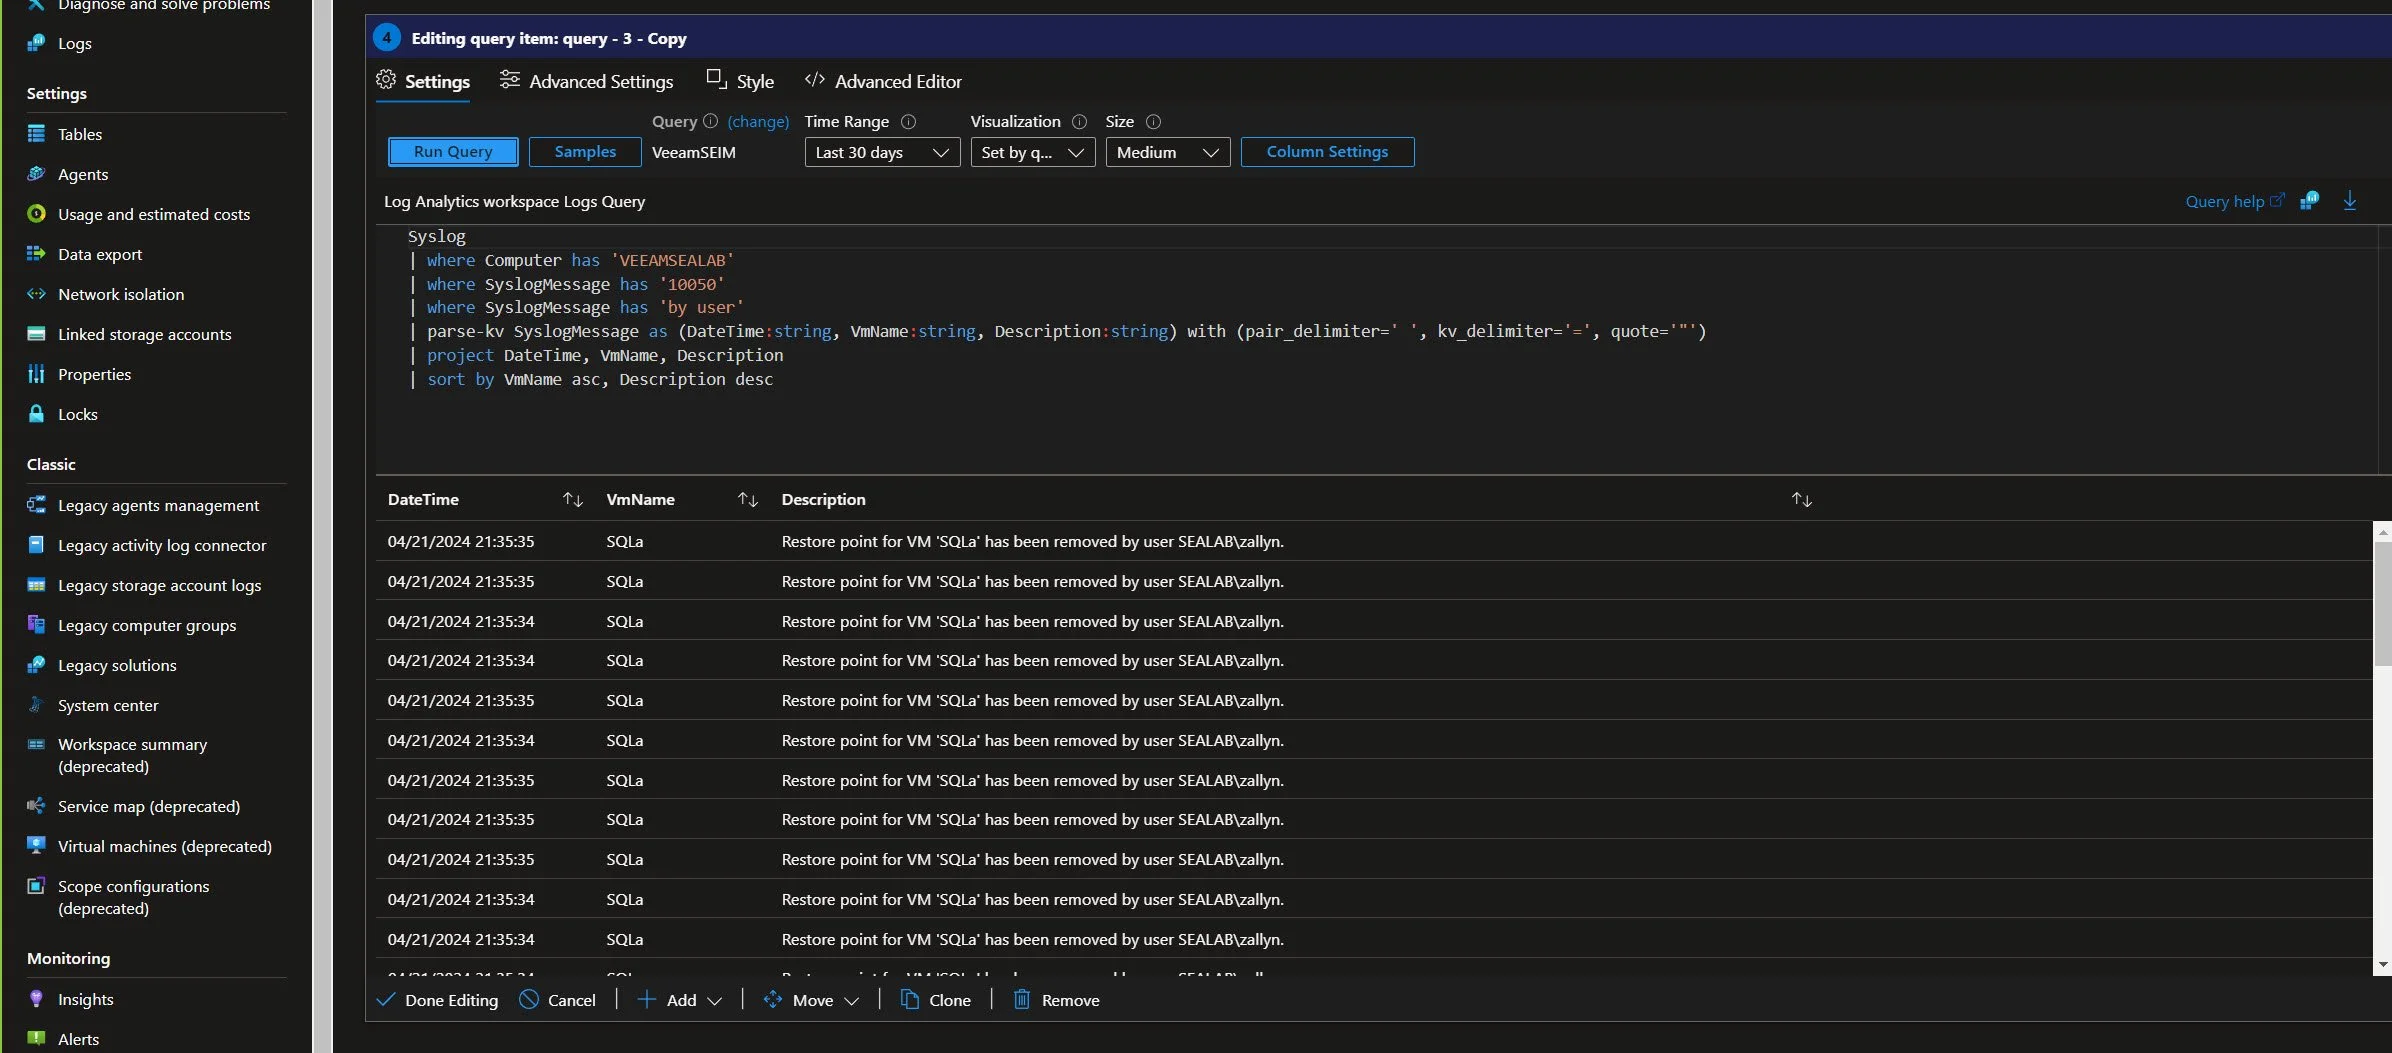
I need to sort out those logs that are not relevant, specifically, events not associated with a particular user account. Focusing on identifying any authorized or compromised account that has deleted a restore point manually. Using an additional WHERE statement of 'by user' I can now track manual deletion of restore points. Focusing on those logs that can help in identifying unauthorized or compromised actions within the system.
Final formatting where I was able to eliminate events I am not concerned with as they were system generated. Not generated by user accounts.
Now, I can see all Restore Point Removed events that were done manually, and by what account. There may be a valid reason for this removal, but I still want to know about it. And there should be a documented reason for this action. Perhaps, if a specific user, such as 'zallyn' above, removes a point, it is a normal event. And I can follow up or look for a change notification.
But it might be cause for alarm if an administrator account, which has no business logging into a VBR server, is involved. I can further use this for more in depth threat hunting. Correlating with other security events from VBR or other collectors in my environment.
Now, you can begin to see how valuable this information can be in an organization security posture. Look for future blogs where I examine long-term storage and use of Azure Data Explorer, trigger incidents and more advanced features of Microsoft Sentinel.


